Continental Drift
El Niño forecasts could help prevent cholera deaths.
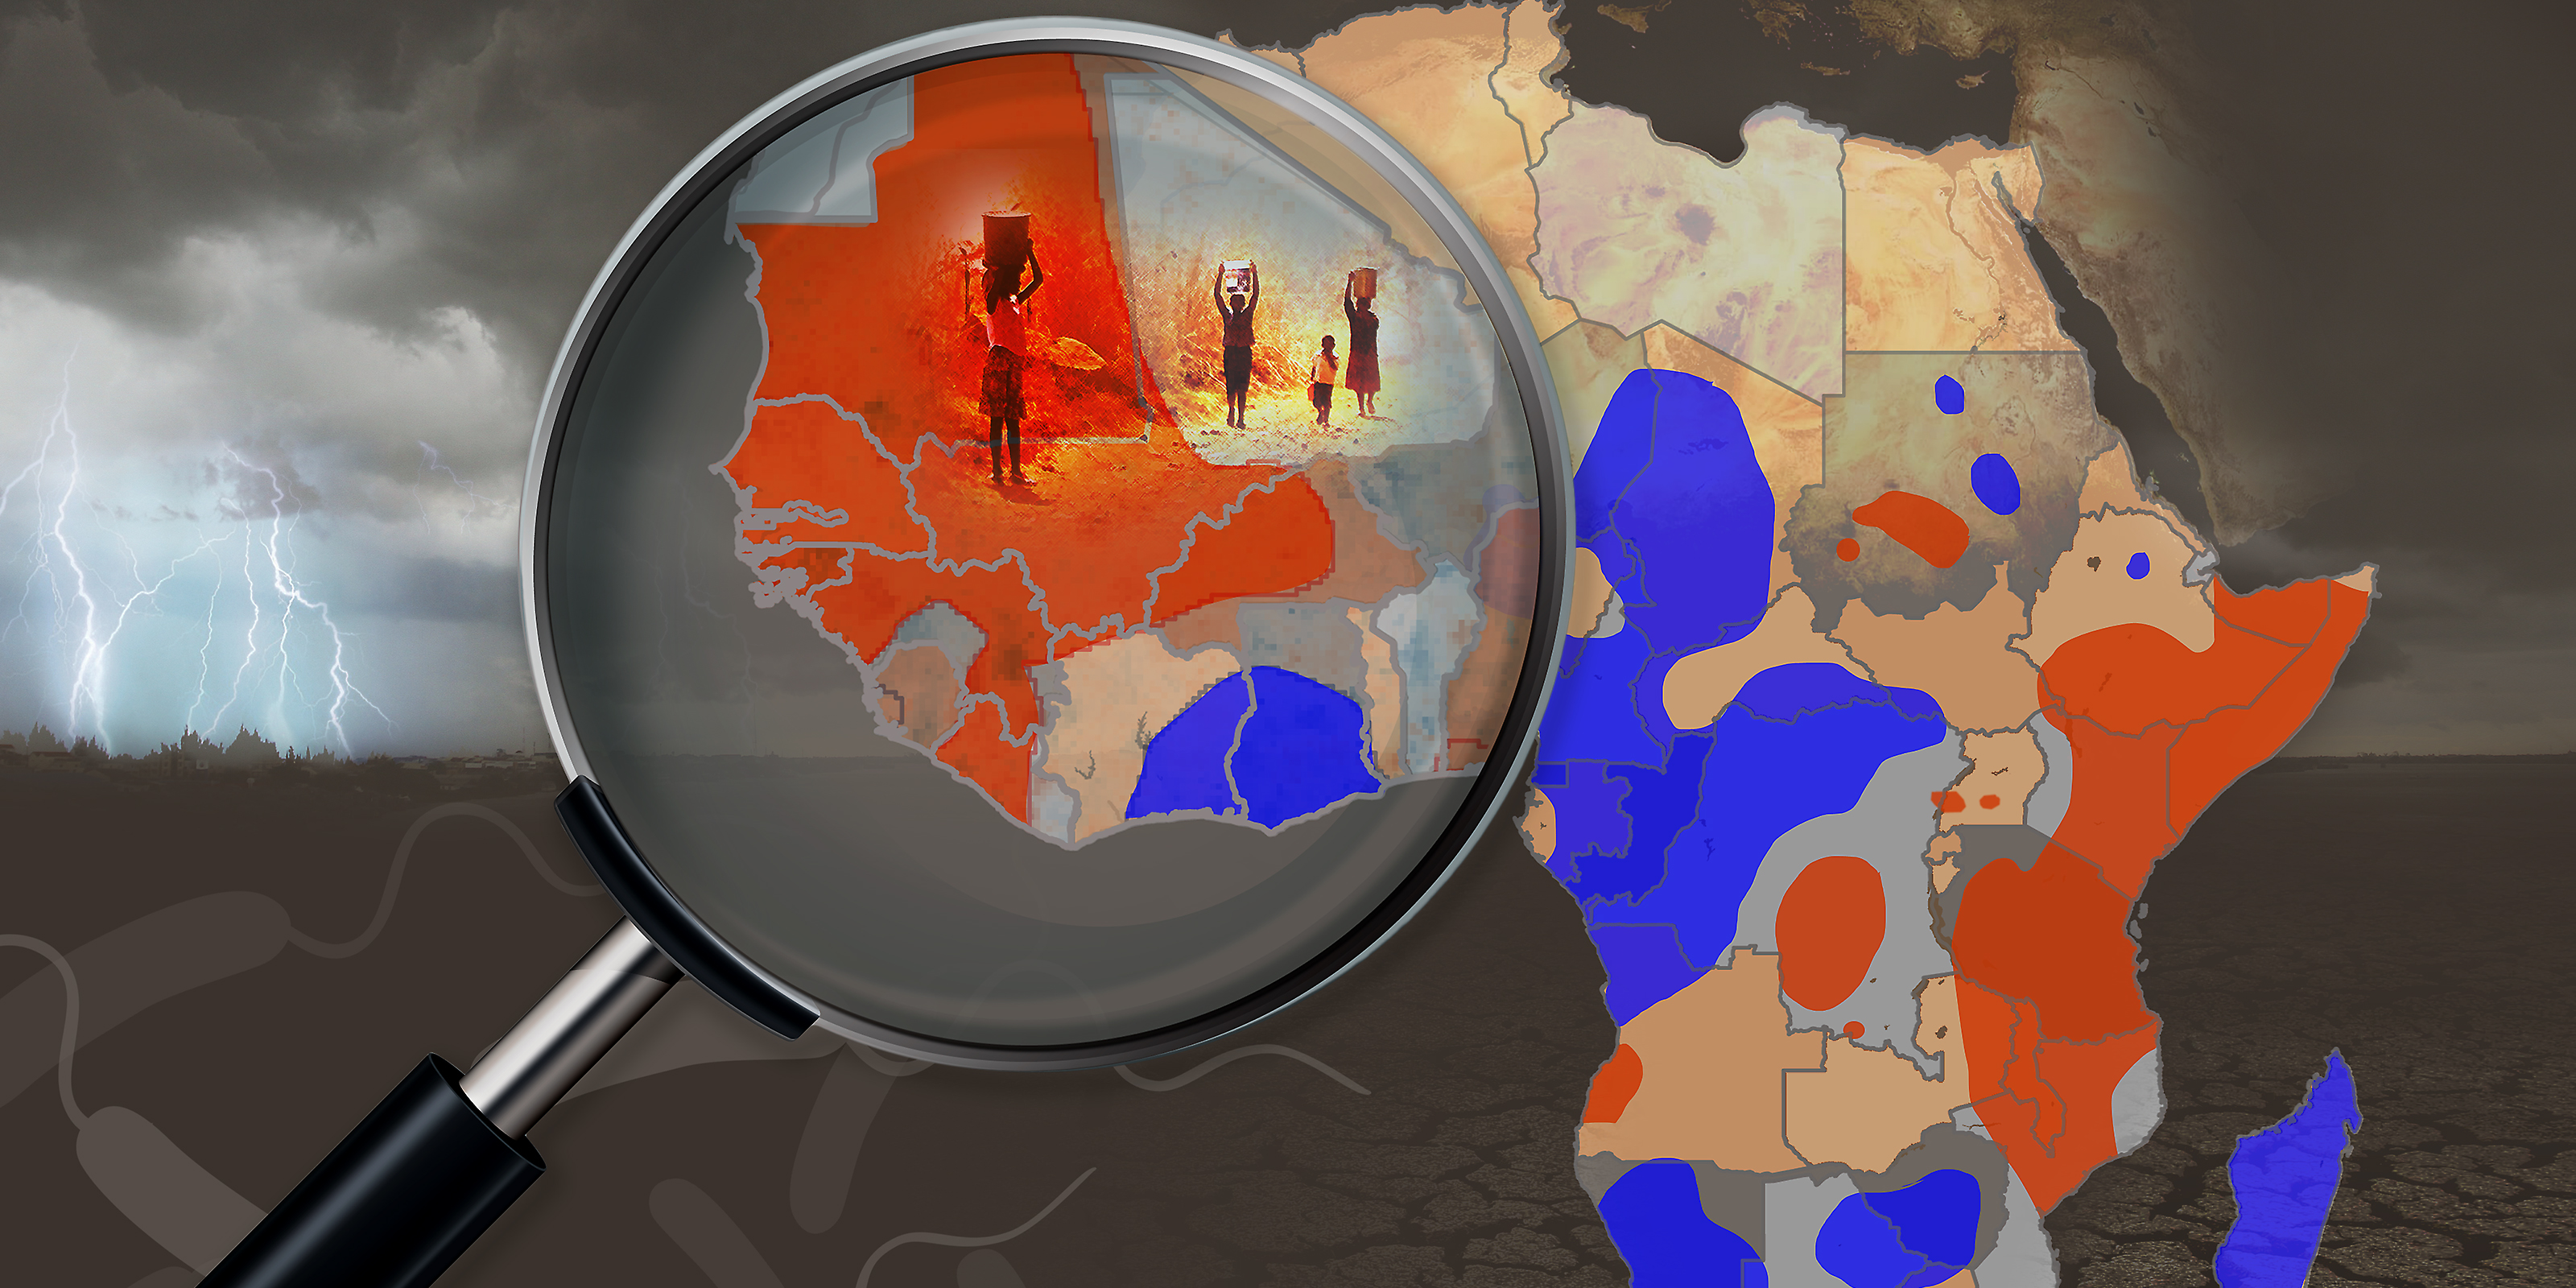
Long known as a powerful disruptor of global weather, El Niño also shifts the geography of cholera in Africa.
When associate professor of Epidemiology Justin Lessler and colleagues mapped annual cholera incidence in Africa from 2000 to 2014, they found something unexpected: While the number of cholera cases across the continent was roughly the same in El Niño and non-El Niño years—about 210,000 cases—there was a big difference in where the disease occurred.
During El Niño years, East Africa experienced about 50,000 more cases of cholera, while Southern, Central and West Africa saw decreases. Interestingly, while most increases in incidence were seen in areas with increased rainfall, some areas with decreased rainfall also saw increases.
“We weren’t able to pick out a single clear association between rainfall and cholera incidence that applies across the continent,” Lessler says. “The epidemiology of cholera is extremely local.”
Knowing when and where cholera incidence is likely to increase can save lives—especially when El Niño forecast information is available up to a year in advance. “We have a vaccine that can be used preemptively,” Lessler says. “If we can get resources and training on the ground ahead of time when risk is highest, we can potentially eliminate mortality from cholera.”
Distilling the Data
Identifying El Niño-sensitive areas started with big, messy data.
-
Step 1
Collected data on cholera incidence from 2000 to 2014 (360 datasets, more than 17,000 observations, 3,000 locations at different scales)
-
Step 2
Combined data on cholera incidence with data on sanitation, distance to clean water and other important variables
-
Step 3
Used spatial mapping techniques to map reported incidence to 20k by 20k grid cells
-
Step 4
Looked at difference in cholera incidence rates in El Niño and non-El Niño years
-
Step 5
Identified clusters where cholera tends to increase and decrease in different regions during El Niño years
-
Step 6
Explored relationship between cholera incidence and shifts in El Niño-associated climate variables, such as rainfall